
New Delhi | November 9, 2026
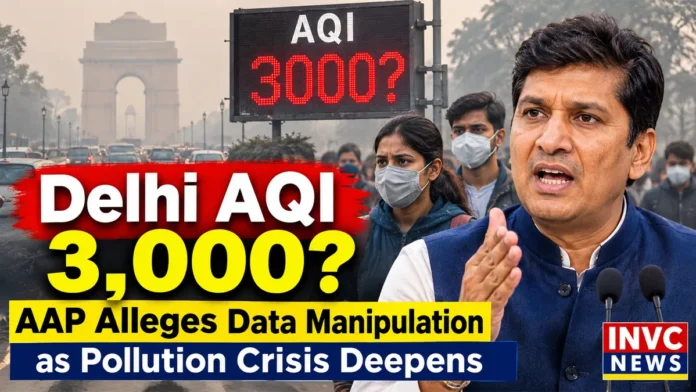
Delhi’s post-Diwali air pollution crisis has triggered a fresh political controversy, with Aam Aadmi Party (AAP) leader Saurabh Bharadwaj claiming that air quality levels crossed the alarming 3,000 mark in several parts of the national capital on Diwali night. His allegations have raised serious questions about the reliability of official pollution monitoring, particularly as government data and independent air quality platforms have reported dramatically different readings.
While the Central Pollution Control Board (CPCB) recorded Delhi’s average Air Quality Index (AQI) at 376 on November 8, placing the city in the ‘Very Poor’ category, some independent monitoring platforms reported substantially higher pollution levels. Bharadwaj has accused the BJP-led Delhi government of manipulating pollution data and concealing the actual severity of the crisis. However, his allegations have not been independently established.
60-Second Brief
- AAP’s allegation: Saurabh Bharadwaj claimed that AQI crossed 3,000 in several Delhi localities on Diwali night.
- Official reading: CPCB recorded Delhi’s average AQI at 376 on November 8.
- Independent readings: AQI.in reported a peak reading of 1,331 at around 1:31 am on November 9.
- Monitoring concerns: Reports indicated that several government monitoring stations stopped transmitting data during peak Diwali pollution hours.
- Political controversy: AAP has questioned the transparency of the Delhi government’s pollution monitoring system.
Saurabh Bharadwaj Questions Delhi’s Official AQI Figures
The controversy intensified after Bharadwaj shared videos on social media platform X, questioning the government’s air quality monitoring arrangements.
In his posts, the AAP leader claimed that pollution levels in several parts of Delhi were significantly higher than the figures being reported by official monitoring agencies.
“AQI 3000 paar,” Bharadwaj wrote, alleging that the government was presenting misleading pollution figures instead of acknowledging the actual situation.
He also accused the authorities of installing approximately 20 new air quality monitoring stations in relatively green and less polluted areas while allegedly allowing water to be sprayed near monitoring stations in heavily polluted neighbourhoods.
According to Bharadwaj, these practices could influence recorded pollution levels and create a misleading picture of the city’s overall air quality.
He further questioned why several monitoring stations were not reporting data during the period when firecracker-related pollution was expected to peak.
These allegations have added a political dimension to Delhi’s already serious environmental crisis. However, the claims concerning deliberate manipulation and the impact of water spraying have not been independently verified.
What Do Official and Independent AQI Readings Show?
The biggest question surrounding the controversy is why different monitoring platforms are displaying such widely varying numbers.
According to CPCB figures, Delhi’s average AQI stood at 376 on November 8, indicating Very Poor air quality. Several monitoring stations across the capital recorded readings in the Severe category.
Jahangirpuri was among the worst-affected locations, recording an AQI of 460 in the evening. Other areas, including Burari Crossing, Vivek Vihar, Rohini and parts of North Delhi, also reported dangerously high pollution levels.
Meanwhile, AQI.in reported that Delhi’s air quality reading peaked at 1,331 at approximately 1:31 am on November 9.
Some independent monitoring platforms also displayed readings above 1,000 in individual locations. These figures, however, cannot automatically be treated as equivalent to CPCB’s official National AQI readings because different platforms may use different calculation methods, monitoring networks and reporting systems.
The distinction is important: India’s National AQI scale ranges from 0 to 500. A figure of 3,000 therefore cannot be interpreted as a standard CPCB National AQI reading. It requires clarification about the underlying measurement, calculation method and monitoring source.
Why Were Several Monitoring Stations Not Reporting Data?
Another important aspect of the controversy concerns gaps in pollution monitoring during Diwali night.
Reports indicated that more than half of Delhi’s 59 monitoring stations stopped reporting data around midnight, when firecracker emissions and other pollution sources were contributing to deteriorating air quality.
An analysis reported by Hindustan Times highlighted that 36 monitoring stations were not transmitting data during part of the critical period.
The interruption raised concerns among environmental observers because an incomplete monitoring network can affect the reliability of citywide pollution assessments.
When several stations stop reporting simultaneously, the available readings may not fully represent conditions across different neighbourhoods. However, missing data alone does not establish that readings were deliberately suppressed or manipulated.
The authorities need to explain why the stations stopped transmitting, whether the interruptions were caused by technical problems and when normal monitoring resumed.
Delhi’s Air Pollution Crisis: Why the Numbers Matter
The disagreement over AQI figures should not distract from the underlying public health emergency.
Even the official CPCB reading of 376 represents a serious pollution situation. Several monitoring locations entered the Severe category, indicating that residents were exposed to unhealthy air.
Fine particulate matter, particularly PM2.5, is a major concern because these extremely small particles can penetrate deep into the lungs and enter the bloodstream.
Exposure to elevated concentrations of particulate pollution can aggravate asthma, worsen existing respiratory and cardiovascular conditions and increase health risks, particularly among children, older people and individuals with pre-existing illnesses.
The health risks do not depend on whether a monitoring platform displays 376, 1,331 or another number. What matters is the actual concentration of harmful pollutants in the air and how long people remain exposed to them.
What Should the Delhi Government Do Now?
The controversy has underlined the need for greater transparency in air quality monitoring.
Environmental authorities should publish station-wise pollution readings, explain monitoring interruptions and clarify the methods used by different platforms to calculate AQI.
Independent technical verification of monitoring equipment and data transmission systems would also help restore public confidence.
The government should additionally strengthen pollution-control measures, enforce applicable GRAP restrictions and provide clear health advisories to residents.
Delhi’s residents need accurate and timely information to make decisions about outdoor activities, school attendance and exposure to polluted air.
The Bigger Picture
The Delhi AQI controversy is about more than a political dispute between the ruling BJP and the opposition AAP. It raises a fundamental question about the credibility, transparency and accessibility of environmental data.
When government agencies and independent platforms display dramatically different pollution figures, citizens are left uncertain about the air they are breathing.
The government must address these discrepancies with verifiable evidence rather than political statements. Equally, allegations of data manipulation must be supported by independent technical findings.
The Bottom Line: Whether the reported figure was 3,000 or substantially lower, Delhi’s post-Diwali pollution crisis is undeniable. Official readings already indicate dangerously unhealthy air, while discrepancies between monitoring platforms demand a transparent explanation. For millions of residents, reliable pollution data is not merely a political issue—it is a matter of public health and safety.