
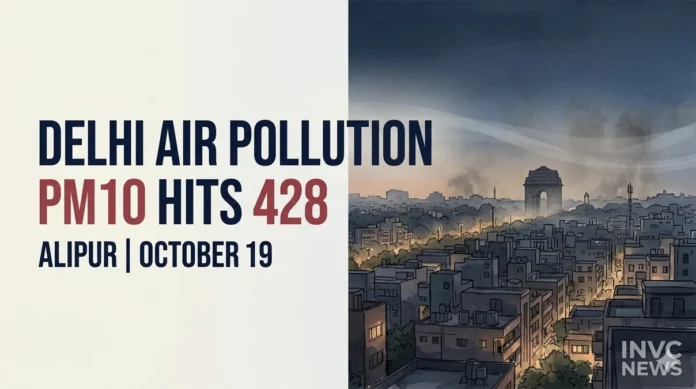
NEW DELHI, October 21, 2026 — Air pollution readings at Delhi’s Alipur monitoring station showed sharp nighttime fluctuations between October 16 and 20, with PM10 concentrations reaching 428 micrograms per cubic meter at around 9 p.m. on October 19. The readings highlight concerns about evening pollution levels as slower winds can limit the dispersal of airborne particles.
Data attributed to the Central Pollution Control Board (CPCB) show that PM10 concentrations varied considerably across the four reported evening observations. Alongside the peak PM10 reading on October 19, the station recorded PM2.5 at 94 micrograms per cubic meter and nitrogen dioxide (NO2) at 90.4 micrograms per cubic meter at approximately the same time.
The figures represent readings from a specific monitoring station and time period. They should not be treated as a citywide average or a complete measure of Delhi’s overall Air Quality Index (AQI).
Alipur Monitoring Data Show Sharp Nighttime Swings
The reported readings at the Alipur station show that PM10 levels did not rise steadily each evening. Instead, concentrations moved up and down substantially over the period.
| Date | Reported time | PM10 concentration |
|---|---|---|
| October 16 | Around 9:45 p.m. | 175 µg/m³ |
| October 17 | Around 9 p.m. | 298 µg/m³ |
| October 18 | Around 9:45 p.m. | 162 µg/m³ |
| October 19 | Around 9 p.m. | 428 µg/m³ |
Source: CPCB Alipur monitoring figures as reported in the supplied news material. The observation times differ slightly between dates.
The October 19 reading was the highest among the four reported observations. The difference between 162 µg/m³ on October 18 and 428 µg/m³ on October 19 illustrates how sharply readings can change from one evening to another.
However, these observations alone do not establish that pollution deteriorates at exactly 9 p.m. every day. A longer series of consistently timed measurements would be needed to determine whether a recurring nighttime pattern exists.
Why Can Air Pollution Worsen at Night?
Several atmospheric and human-related factors can contribute to elevated pollution concentrations after sunset.
Slower wind speeds: Wind helps disperse pollutants away from their sources. When winds weaken, particles emitted by vehicles, construction activities and other sources may remain concentrated near the ground for longer.
Falling temperatures: As the ground cools after sunset, the lower atmosphere can become more stable. Under certain conditions, this reduces vertical mixing and makes it harder for pollutants to disperse.
Temperature inversion: A temperature inversion occurs when warmer air sits above cooler air near the surface, limiting the upward movement of air. When an inversion develops, pollutants can become trapped closer to the ground. Whether this occurred during the reported Alipur readings would require supporting meteorological data.
Traffic and road dust: Vehicle emissions can contribute to nitrogen dioxide and fine particles, while dust from roads, construction and other activities can add to PM10 concentrations. The relative contribution of each source cannot be established from the reported readings alone.
The combination of emissions, atmospheric stability and weak winds can therefore influence nighttime pollution levels. Establishing the precise cause of the October 19 spike would require a closer examination of wind speed, wind direction, temperature profiles and local emission sources.
PM10 at 428: How Significant Is the Reading?
India’s National Ambient Air Quality Standards set a 24-hour average limit of 100 micrograms per cubic meter for PM10. The reported reading of 428 µg/m³ is more than four times that numerical benchmark.
There is an important distinction, however: the 428 figure is a reported observation at a particular time, while the national standard applies to a 24-hour average. Comparing the two numbers provides context for the magnitude of the reading, but it does not establish whether the formal 24-hour standard was exceeded on that basis alone.
PM10 refers to airborne particles with a diameter of 10 micrometers or less. These particles can enter the respiratory system, and exposure to elevated particle pollution can aggravate respiratory conditions and contribute to other health risks.
PM2.5 consists of smaller particles, generally 2.5 micrometers or less in diameter, that can penetrate deeper into the lungs. The reported PM2.5 reading of 94 µg/m³ is therefore another relevant indicator of pollution at the station, although its interpretation also depends on the averaging period and the wider monitoring record.
What Residents Can Do During High-Pollution Periods
A single monitoring station cannot describe the air quality on every Delhi street. Residents should check the latest official AQI for their location before making decisions about outdoor activities.
When air pollution is elevated, practical precautions include:
- Limit strenuous outdoor activity: Consider reducing prolonged or intense exercise near busy roads when local air quality is poor.
- Pay attention to symptoms: People experiencing unusual breathlessness, wheezing, chest discomfort or persistent coughing should seek appropriate medical advice.
- Take extra care with respiratory conditions: Children, older adults and people with asthma or other heart and lung conditions may be more vulnerable to particle pollution.
- Check local readings: Consult current CPCB monitoring data and official air-quality updates rather than relying on a single station or one evening’s reading.
- Reduce indoor particle exposure: Keep windows closed during periods of particularly poor outdoor air when practical, and use effective indoor filtration if available.
These measures can help reduce exposure, but they do not eliminate the need for broader action to control emissions and road dust.
What the Data Tell Us—and What They Do Not
The Alipur observations point to substantial variation in PM10 concentrations during the reported evening hours, culminating in a reading of 428 µg/m³ on October 19. Slower winds and a stable lower atmosphere are plausible contributors to nighttime pollution, but the supplied figures do not independently confirm which factors caused the spike.
A more complete assessment would combine hourly pollutant concentrations with wind speed, wind direction, temperature, humidity and measurements from other monitoring stations across Delhi.
Bottom Line: Delhi’s reported Alipur readings show why nighttime pollution deserves attention. The October 19 PM10 peak was markedly higher than the other observations listed, but a sustained trend and the precise causes can only be established through broader monitoring and meteorological analysis. Residents should follow current local AQI updates and take sensible precautions when pollution levels are high.