

Highlights of Telecom Subscription Data as on August 31, 2022
New Delhi ,
| Particulars | Wireless | Wireline | Total (Wireless+ Wireline) |
| Total Telephone Subscribers (Million) | 1149.11 | 25.97 | 1175.08 |
| Net Addition in August, 2022 (Million) | 1.08 | 0.34 | 1.43 |
| Monthly Growth Rate | 0.09% | 1.34% | 0.12% |
| Urban Telephone Subscribers (Million) | 627.09 | 23.98 | 651.07 |
| Net Addition in August, 2022 (Million) | 0.35 | 0.33 | 0.67 |
| Monthly Growth Rate | 0.06% | 1.38% | 0.10% |
| Rural Telephone Subscribers (Million) | 522.02 | 1.99 | 524.01 |
| Net Addition in August, 2022 (Million) | 0.73 | 0.016 | 0.75 |
| Monthly Growth Rate | 0.14% | 0.83% | 0.14% |
| Overall Tele-density*(%) | 83.27% | 1.88% | 85.15% |
| Urban Tele-density*(%) | 129.75% | 4.96% | 134.71% |
| Rural Tele-density*(%) | 58.22% | 0.22% | 58.44% |
| Share of Urban Subscribers | 54.57% | 92.35% | 55.41% |
| Share of Rural Subscribers | 45.43% | 7.65% | 44.59% |
| Broadband Subscribers (Million) | 783.57 | 30.37 | 813.94 |
- In the month of August, 2022, 11.35 million subscribers submitted their requests for Mobile Number Portability (MNP). With this, the cumulative MNP requests increased from 724.79 million at the end of July-22 to 736.14 million at the end of August-22, since implementation of MNP.
- Number of active wireless subscribers (on the date of peak VLR#) in August, 2022 was 1013.46 million.
- Total Telephone Subscribers
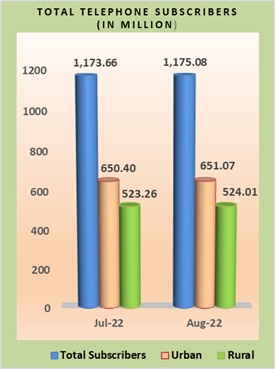
- The number of telephone subscribers in India increased from 1,173.66 million at the end of July-22 to 1,175.08 million at the end of August-22, thereby showing a monthly growth rate of 0.12%. Urban telephone subscription increased from 650.40 million at the end of July-22 to 651.07 million at the end of August-22 and the rural subscription also increased from 523.26 million to 524.01 million during the same period. The monthly growth rates of urban and rural telephone subscription were 0.10% and 0.14% respectively during the month of August-22.
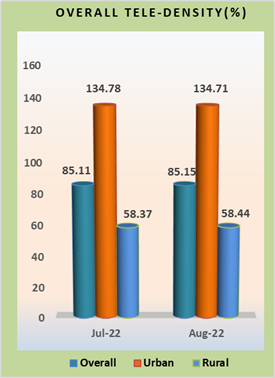
- The overall Tele-density in India increased 85.11% at the end of July-22 to 85.15% at the end of August-22. The Urban Tele-density decreased from 134.78% at the end of July-22 to 134.71% at the end of August-22 however, Rural Tele-density increased from 58.37% to 58.44% during the same period. The share of urban and rural subscribers in total number of telephone subscribers at the end of August-22 was 55.41% and 44.59% respectively.
Overall Tele-density (LSA Wise) – As on 31st August, 2022
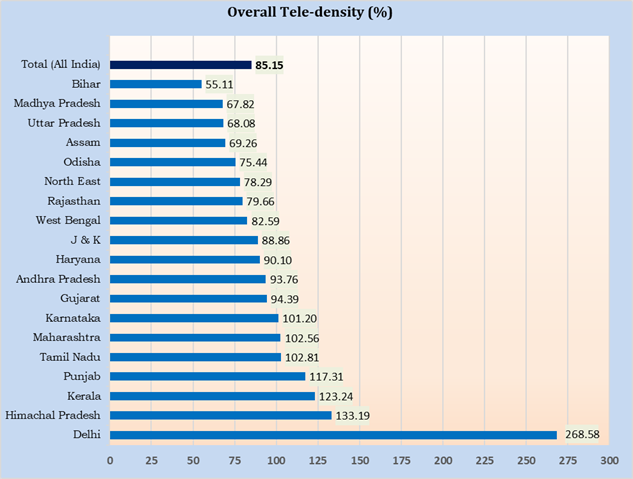
- As may be seen in the above chart, eight LSA have less tele-density than the all-India average tele-density at the end of August-22. Delhi service area has maximum tele-density of 268.58% and the Bihar service area has minimum tele-density of 55.11% at the end of August-22.
- Category-wise Growth in subscriber base
Circle Category-wise Net Additions in Telephone Subscribers in the month of August 2022
| Circle Category | Net additions in the month of August, 2022 | Telephone Subscriber base as on 31st August, 2022 | ||
| Wireline segment | Wireless segment | Wireline segment | Wireless segment | |
| Circle A | 1,18,510 | -2,08,946 | 99,26,318 | 38,62,80,358 |
| Circle B | 1,27,243 | 1,30,735 | 63,15,276 | 47,04,28,230 |
| Circle C | 40,229 | 10,72,244 | 17,16,737 | 18,17,40,967 |
| Metro | 57,808 | 87,382 | 80,11,939 | 11,06,61,718 |
| All India | 3,43,790 | 10,81,415 | 2,59,70,270 | 1,14,91,11,273 |
Circle Category-wise monthly and yearly Growth Rates in Telephone Subscribers in the month of August 2022
| Circle Category | Monthly growth rate (%) (July-22 to August-22) | Yearly growth rate (%) (August-21 to August-22) | ||
| Wireline Segment | Wireless Segment | Wireline Segment | Wireless Segment | |
| Circle A | 1.21% | -0.05% | 13.25% | -4.23% |
| Circle B | 2.06% | 0.03% | 21.77% | -2.55% |
| Circle C | 2.40% | 0.59% | 31.78% | -0.54% |
| Metro | 0.73% | 0.08% | 5.35% | -6.12% |
| All India | 1.34% | 0.09% | 13.61% | -3.17% |
- As can be seen in the above tables, in wireless segment, on monthly basis except Circle ‘A’ all circles have registered growth rate in their subscriber base. On yearly basis, all circles have registered decline rate in their subscriber base.
- In Wireline segment both on monthly and yearly basis, all circles have registered growth rate in their subscriber base.
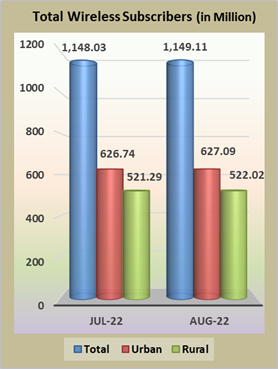
- Wireless subscriber
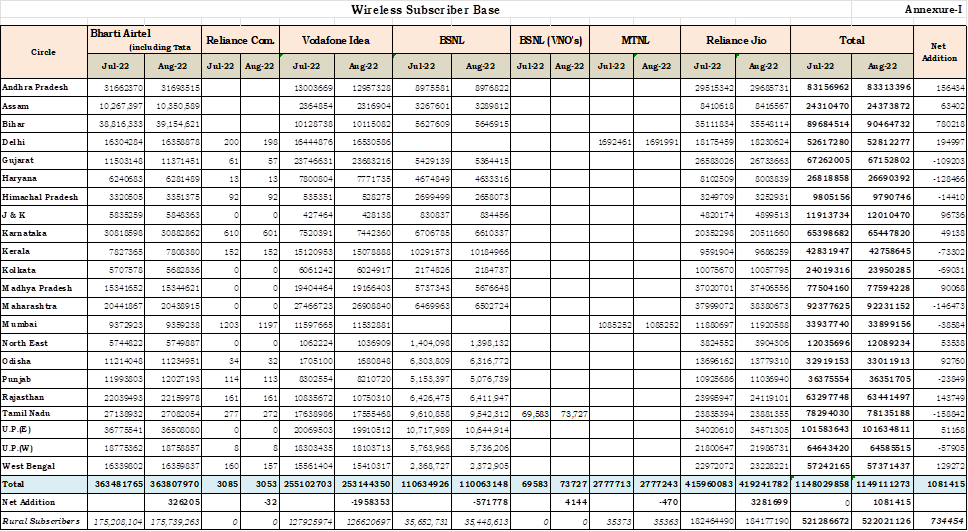
- Total wireless subscribers increased from 1,148.03 million at the end of July-22, to 1,149.11 million at the end of August-22, thereby registering a monthly growth rate of 0.09%. Wireless subscription in urban areas increased from 626.74 million at the end of July-22 to 627.09 million at the end of August-22 and wireless subscription in rural areas also increased from 521.29 million to 522.02 million during the same period. Monthly growth rates of urban and rural wireless subscription were 0.06% and 0.14% respectively.
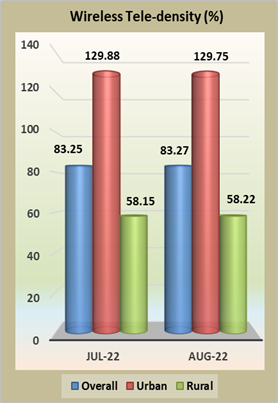
- The Wireless Tele-density in India increased from 83.25% at the end of July-22 to 83.27% at the end of August-22. The Urban Wireless Tele-density decreased from 129.88% at the end of Jul-22 to 129.75% at the end of August-22, however Rural Tele-density increased from 58.15% to 58.22% during the same period. The share of urban and rural wireless subscribers in total number of wireless subscribers was 54.57% and 45.43% respectively at the end of Aug-22. Detailed statistics of wireless subscriber base is available at Annexure-I.
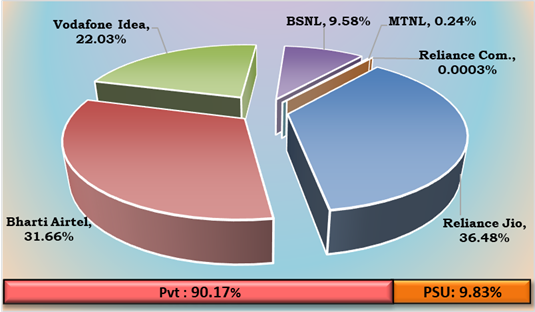
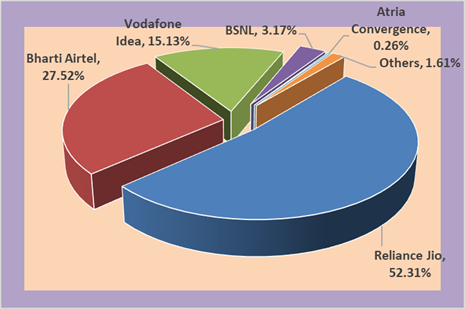
• As on 31st August, 2022, the private access service providers held 90.17% market share of the wireless subscribers whereas BSNL and MTNL, the two PSU access service providers, had a market share of only 9.83%.
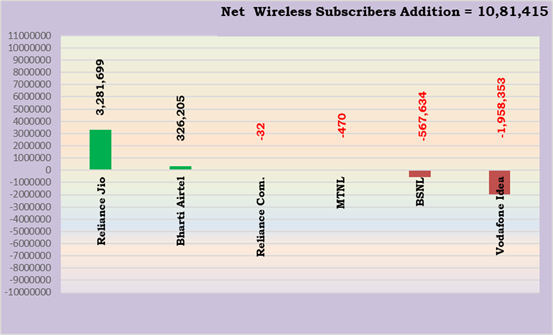
- The graphical representation of access service provider-wise market share and net additions in wireless subscriber base are given below: –
Access Service Provider-wise Market Shares in term of Wireless Subscribers as on 31st August, 2022
Net Addition in Wireless Subscribers of Access Service Providers in the month of August, 2022
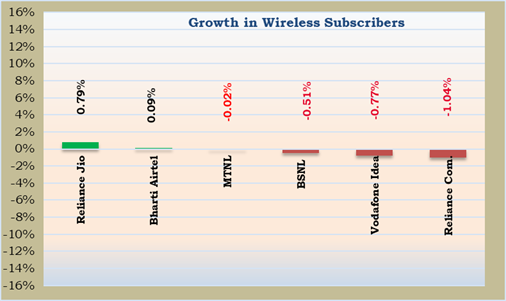
Growth in Wireless Subscribers
Access Service Provider-wise Monthly Growth Rate of Wireless Subscribers in the month of August, 2022
Note: BSNL includes its Virtual Network Operator (VNO).
Service Area-wise Monthly Growth Rate of Wireless Subscribers in the month of August, 2022
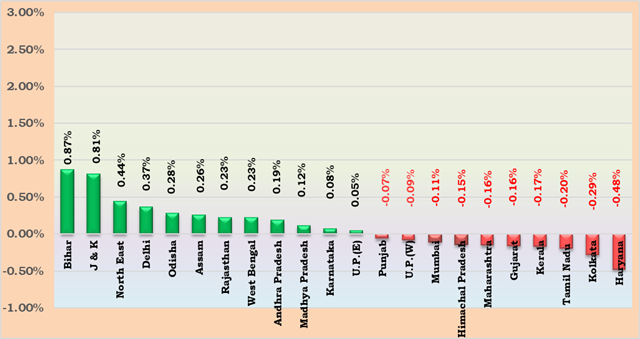
- Except Punjab, U.P.(W), Mumbai, Himachal Pradesh, Maharashtra, Gujarat, Kerala, Tamil Nadu, Kolkata and Haryana service areas, all other service areas have showed growth rate in their wireless subscribers during the month of August-22.
- Active Wireless Subscribers (VLR Data)
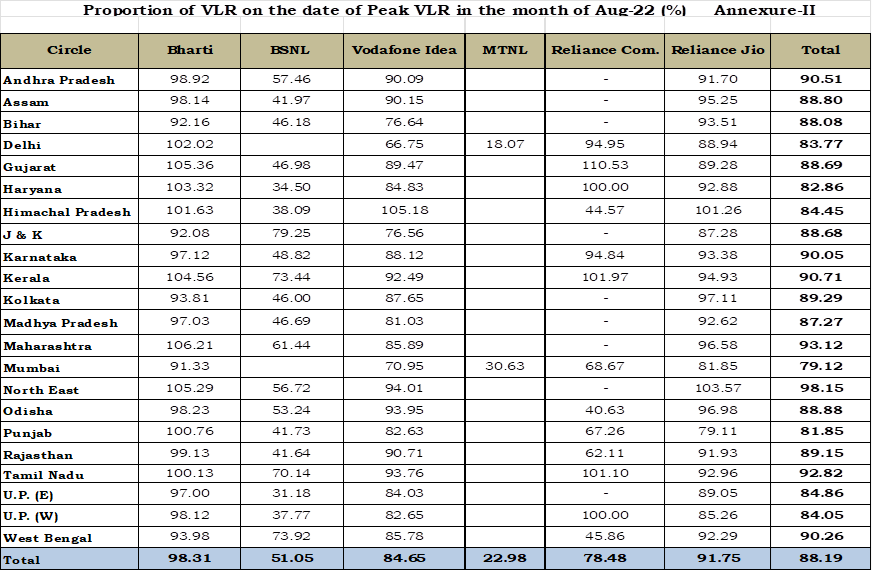
- Out of the total 1,149.11 million wireless subscribers, 1013.46 million wireless subscribers were active on the date of peak VLR in the month of August-22. The proportion of active wireless subscribers was approximately 88.19% of the total wireless subscriber base.
- The detailed statistics on proportion of active wireless subscribers (also referred to as VLR subscribers) on the date of peak VLR in the month of August-22 is available at Annexure-II and the methodology used for reporting VLR subscribers is available at Annexure-IV.
Access Service Provider-wise Percentage of VLR Subscribers
in the month of August, 2022
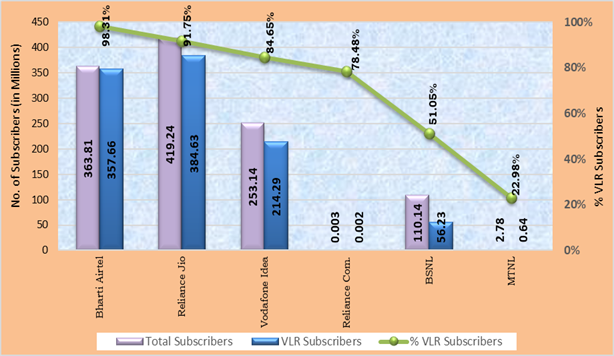
- Bharti Airtel has the maximum proportion 98.31% of its active wireless subscribers (VLR) as against its total wireless subscribers (HLR) on the date of peak VLR in the month of August-22 and MTNL has the minimum proportion of VLR 22.98% of its HLR during the same period.
Service Area wise percentage of VLR Subscribers
in the month of August, 2022

VI. Mobile Number Portability (MNP)
- Intra-service area Mobile number portability (MNP) was implemented first in Haryana service area w.e.f. 25.11.2010 and in the rest of the country w.e.f. 20.01.2011. Inter-Service Area MNP has been implemented in the country w.e.f. 03.07.2015. Now, the wireless telephone subscribers can retain their mobile numbers when they relocate from one service area to another.
- During the month of August-22, a total of 11.35 million requests were received for MNP. Out of total 11.35 million new requests, 6.79 million requests received from Zone-I and 4.56 million requests received from Zone-II. The cumulative MNP requests increased from 724.79 million at the end of July-22 to 736.14 million at the end of August-22, since the implementation of MNP.
- In MNP Zone-I (Northern and Western India), the highest number of requests till date have been received in Maharashtra (about 60.66 million) followed by Uttar Pradesh-East (about 59.27 million) service area.
- In MNP Zone-II (Southern and Eastern India), the highest number of requests till date have been received in Karnataka (about 55.71 million) followed by Madhya Pradesh (about 54.59 million).
| Service Area Wise MNP Status | |||||
| Zone -1 | Zone – 2 | ||||
| Service Area | Number of Porting Requests (in Million) | Service Area | Number of Porting Requests (in Million) | ||
| Jul-22 | Aug-22 | Jul-22 | Aug-22 | ||
| Delhi | 34.85 | 35.35 | Andhra Pradesh | 53.35 | 53.90 |
| Gujarat | 49.03 | 49.89 | Assam | 5.21 | 5.29 |
| Haryana | 23.88 | 24.18 | Bihar | 37.01 | 37.71 |
| Himachal Pradesh | 3.26 | 3.30 | Karnataka | 55.11 | 55.71 |
| Jammu & Kashmir | 1.66 | 1.68 | Kerala | 19.18 | 19.39 |
| Maharashtra | 59.72 | 60.66 | Kolkata | 14.60 | 14.75 |
| Mumbai | 28.06 | 28.29 | Madhya Pradesh | 53.60 | 54.59 |
| Punjab | 26.23 | 26.55 | North East | 1.79 | 1.81 |
| Rajasthan | 51.76 | 52.55 | Odisha | 13.73 | 13.87 |
| U.P.(East) | 57.69 | 59.27 | Tamil Nadu | 51.22 | 51.65 |
| U.P.(West) | 45.23 | 46.44 | West Bengal | 38.61 | 39.29 |
| Total | 381.38 | 388.17 | Total | 343.42 | 347.98 |
| Total (Zone-1 + Zone-2) | 724.79 | 736.14 | |||
| Net Addition (August, 2022) | 11.35 million | ||||
VII. Wireline Subscribers
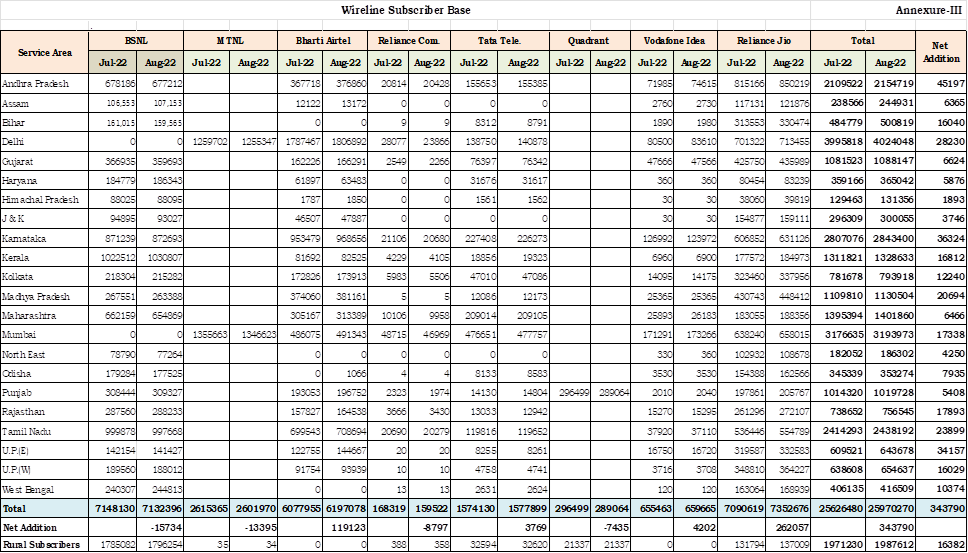
- Wireline subscribers increased from 25.63 million at the end of July-22 to 25.97 million at the end of August-22. Net increase in the wireline subscriber base was 0.34 million with a monthly growth rate of 1.34%. The share of urban and rural subscribers in total wireline subscribers were 92.35% and 7.65% respectively at the end of August, 2022.
- The Overall Wireline Tele-density in India increased from 1.86% at the end of July-22 to 1.88% at the end of August-22. Urban and Rural Wireline Tele-density were 4.96% and 0.22% respectively during the same period.
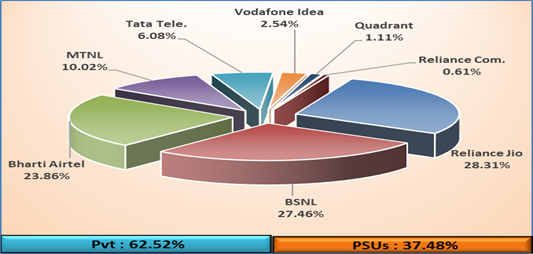
- BSNL and MTNL, the two PSU access service providers, held 37.48% of the wireline market share as on 31st August, 2022. Detailed statistics of wireline subscriber base are available at Annexure-III.
Access Service Provider-wise Market Share of Wireline Subscribers as on 31st August, 2022
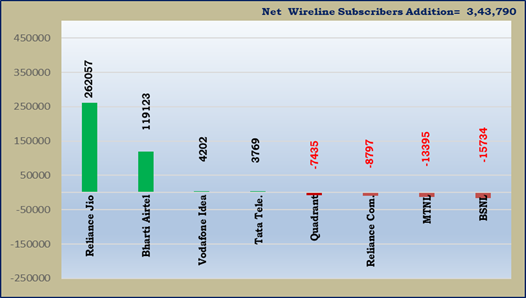
Access Service Provider-wise Net Addition/Decline in Wireline Subscribers during the month of August, 2022
VIII. Broadband Subscriber
- As per the information received from 767 operators in August, 2022 in comparison to 694 Operator in July 2022, the total Broadband Subscribers increased from 807.42 million at the end of July-22 to 813.94 million at the end of August-22 with a monthly growth rate of 0.81%. Segment-wise broadband subscribers and their monthly growth rates are as below
Segment–wise Broadband Subscribers and Monthly Growth Rate in the month of August, 2022
| Segment | Broadband subscribers (in million) | Monthly growth rate in the month of August, 2022 | |
| As on 31st July, 2022 | As on 31st Aug, 2022 | ||
| Wired subscribers | 29.47 | 30.37 | 3.06% |
| Mobile devices users (Phones and dongles) | 776.81 | 782.46 | 0.73% |
| Fixed Wireless subscribers (Wi-Fi, Wi-Max, Point-to-Point Radio & VSAT) | 1.14 | 1.11 | -2.37% |
| Total | 807.42 | 813.94 | 0.81% |
- Top five service providers constituted 98.39% market share of the total broadband subscribers at the end of August-22. These service providers were Reliance Jio Infocomm Ltd (425.80 million), Bharti Airtel (223.98 million), Vodafone Idea (123.12 million), BSNL (25.80 million) and Atria Convergence (2.13 million).
- The graphical representation of the service provider-wise market share of broadband services is given below: –
Service Provider-wise Market Share of Broadband
(wired + wireless) Services as on 31st August, 2022
- As on 31st August, 2022, the top five Wired Broadband Service providers were Reliance Jio Infocomm Ltd (6.56 million), Bharti Airtel (5.13 million), BSNL (3.88 million), Atria Convergence Technologies (2.13 million) and Hathway Cable & Datacom (1.13 million).
- As on 31st August, 2022, the top five Wireless Broadband Service providers were Reliance Jio Infocom Ltd (419.24 million), Bharti Airtel (218.85 million), Vodafone Idea (123.12 million), BSNL (21.92 million) and Intech Online Pvt. Ltd. (0.23 million).
Contact details in case of any clarification:
Shri Amit Sharma, Advisor (F&EA),
Telecom Regulatory Authority of India
Mahanagar Doorsanchar Bhawan
Jawahar Lal Nehru Marg,
New Delhi – 110002,
Ph: 011-23234367 Fax: 011-23235249
E-mail: advfea2@trai.gov.in
Note: Peak VLR figures in some circles of some of the service providers are more than their HLR figures due to a large number of inroamers.
Annexure IV
VLR Subscribers in the Wireless Segment
Home Location Register (HLR) is a central database that contains details of each mobile phone subscriber that is authorized to use the GSM core network. The HLRs store details of every SIM card issued by the service provider. Each SIM has a unique identifier called an International Mobile Subscriber Identity (IMSI), which is the primary key to each HLR record. The HLR data is stored for as long as a subscriber remains with the service provider. HLR also manages the mobility of subscribers by means of updating their position in administrative areas. It sends the subscriber data to a Visitor Location Register (VLR).
Subscriber numbers reported by the service providers is the difference between the numbers of IMSI registered in service provider’s HLR and sum of other figures as given below: –
| 1 | Total IMSI’s in HLR (A) |
| 2 | Less: (B = a + b + c + d + e) |
| a. | Test/Service Cards |
| b. | Employees |
| c. | Stock in hand/in Distribution Channels (Active Card) |
| d. | Subscriber Retention period expired |
| e. | Service suspended pending disconnection |
| 3 | Subscribers Base (A-B) |
Visitor Location Register (VLR) is a temporary database of the subscribers who have roamed into the particular area, which it serves. Each base station in the network is served by exactly one VLR; hence a subscriber cannot be present in more than one VLR at a time.
If subscriber is in active stage i.e. he is able to send/receive calls/SMSs he is available both in HLR and VLR. However, it may be possible that the subscriber is registered in HLR but not in VLR due to the reason that he is either switched-off or moved out of coverage area, not reachable etc. In such circumstances he will be available in HLR but not in VLR. This causes difference between subscriber number reported by the service providers based on HLR and numbers available in VLR.
The VLR subscriber data calculated here is based on active subscribers in VLR on the date of Peak subscriber number in VLR of the particular month for which the data is being collected. This data is to be taken from the switches having the purge time of not more than 72 hours.


